Advanced Volatility and Risk-Adjusted Return Indicator
Table of Contents
Advanced Volatility and Risk-Adjusted Return Indicator
Educational Tool for Traders & Indie Language Learners v1.0 | For educational use | All experience levels
What This Indicator Does
This tool combines three foundational financial concepts into a single visualization, bridging technical analysis with portfolio theory:
| Metric | Formula/Core Concept | What It Reveals |
|---|---|---|
| Standard Deviation (Yellow) | σ = √[Σ(x - μ)² / N] |
Price volatility risk over time |
| Sharpe Ratio (Blue) | (Return - Risk-Free Rate) / σ |
Quality of risk-adjusted returns |
| ARCH Volatility (Red) | Nobel-winning volatility clustering model | Market turbulence regimes |
Why It Matters for Traders
- Risk Awareness:
- Rising StdDev → Expanding risk (prepare for larger swings)
- High Sharpe → Efficient capital allocation (validate strategy edges)
- ARCH spikes → Early warning for volatility regimes (hedging signals)
- Cross-Market Insights:
- Works on stocks, crypto, forex (adjust
vol_scaleper asset) - Compare assets: Higher Sharpe = better risk/reward profile
- Works on stocks, crypto, forex (adjust
- Educational Value:
- Visualizes Robert Engle’s Nobel-winning ARCH model in action
- Demonstrates modern portfolio theory (MPT) fundamentals
Code Logic for Developers
Key Indie Language Features Demonstrated:
# 1. Parameterization with decorators
@param.int('stddev_length', default=20)
@param.float('risk_free_rate', default=0.01)
# 2. Series handling & mutable data
returns = MutSeriesF.new(0)
returns[0] = (self.close[0] - self.close[1]) / self.close[1]
# 3. Built-in algorithms
stddev = StdDev.new(returns, stddev_length)[0]
# 4. Annualization logic (real-world scaling)
daily_rf = (1 + risk_free_rate) ** (1/252) - 1
sharpe_ratio = (annual_return - risk_free_rate) / annual_volatility
Best Practices Illustrated:
- Parameter validation (
min=1guards) - Safe division checks (
if ... != 0) - Volatility scaling for visual clarity
Learning Pathways
For Traders:
- Study ARCH spikes during FOMC/news events
- Backtest strategies when Sharpe > 1.5
- Compare StdDev vs. ARCH to detect “quiet before storm” patterns
For Indie Developers:
- Learn series mutation with
MutSeriesF - Practice timeframe conversions (daily→annual)
- Explore decorator-based parameter systems
Visualization Tips
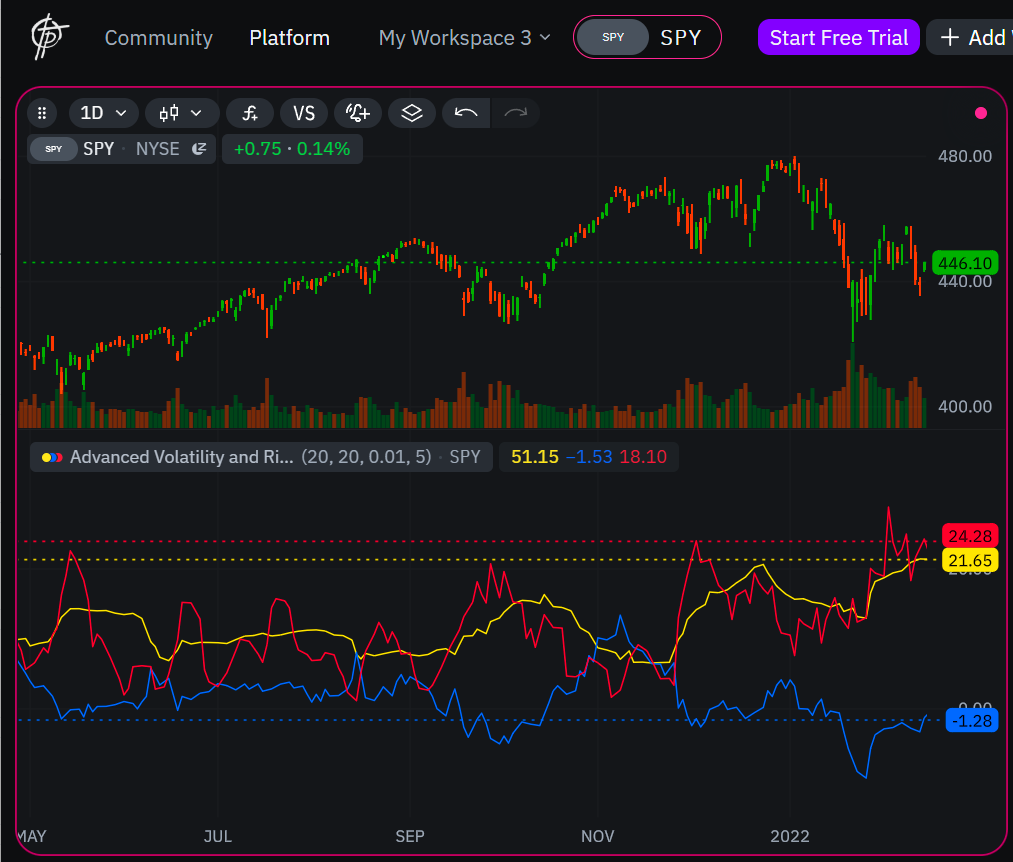 Color coding: Yellow=StdDev, Blue=Sharpe, Red=ARCH
- Crypto (1D): Use
vol_scale=100, watch ARCH during BTC halvings - Stocks (1H): Set
risk_free_rate=0.03(T-bill rate), track sector rotations - Forex (15M):
arch_lag=3for intraday volatility clusters
Theoretical Foundation
- Modern Portfolio Theory (MPT): Sharpe Ratio optimization
- Volatility Clustering: Engle’s ARCH model (Nobel 2003)
- Risk-Adjusted Returns:
Excess Return / Unit Riskframework*“This isn’t just an indicator—it’s a window into how quants model markets.”*
Indie v5 Script code
#education purpose
# indie:lang_version = 5
import math
from indie import indicator, param, plot, color, MutSeriesF
from indie.algorithms import StdDev, Sma

@indicator('Advanced Volatility and Risk-Adjusted Return Indicator', overlay_main_pane=False)
@param.int('stddev_length', default=20, min=1, title='Standard Deviation Length')
@param.int('sharpe_length', default=20, min=1, title='Return Period for Sharpe Ratio')
@param.float('risk_free_rate', default=0.01, title='Risk-Free Rate (annual)')
@param.int('arch_lag', default=5, min=1, title='ARCH Lag')
@param.float('vol_scale', default=100.0, min=1.0, title='Volatility Scaling Factor')
@plot.line(color=color.YELLOW, title='Standard Deviation')
@plot.line(color=color.BLUE, title='Sharpe Ratio')
@plot.line(color=color.RED, title='ARCH Volatility')
def Main(self, stddev_length, sharpe_length, risk_free_rate, arch_lag, vol_scale):
    # 1. Calculation of daily returns
    returns = MutSeriesF.new(0)
    if len(self.close) > 1 and self.close[1] != 0:
        returns[0] = (self.close[0] - self.close[1]) / self.close[1]

    # 2. Annual risk-free rate → daily
    daily_rf = (1 + risk_free_rate) ** (1/252) - 1

    # 3. Volatility (standard deviation)
    stddev_daily = StdDev.new(returns, stddev_length)[0]
    stddev_annual = stddev_daily * math.sqrt(252) * vol_scale

    # 4. Sharpe Ratio
    avg_return_daily = Sma.new(returns, sharpe_length)[0]
    avg_return_annual = avg_return_daily * 252
    sharpe_ratio = (avg_return_annual - risk_free_rate) / (stddev_annual / vol_scale) if (stddev_annual / vol_scale) != 0 else 0

    # 5. ARCH volatility
    mean_return = Sma.new(returns, arch_lag)[0]
    squared_dev = (returns[0] - mean_return) ** 2
    arch_vol_daily = math.sqrt(Sma.new(MutSeriesF.new(squared_dev), arch_lag)[0])
    arch_vol_annual = arch_vol_daily * math.sqrt(252) * vol_scale

    return stddev_annual, sharpe_ratio, arch_vol_annual
Pine Script 5 code
//@version=5
indicator("Advanced Volatility and Risk-Adjusted Return Indicator", overlay=false)

// Input parameters
stddev_length = input.int(20, title="Standard Deviation Length", minval=1)
sharpe_length = input.int(20, title="Return Period for Sharpe Ratio", minval=1)
risk_free_rate = input.float(0.01, title="Risk-Free Rate (annual)")
arch_lag = input.int(5, title="ARCH Lag", minval=1)
vol_scale = input.float(100.0, title="Volatility Scaling Factor", minval=1.0)

// 1. Daily returns
returns = nz(close / close[1] - 1)

// 2. Convert annual risk-free rate to daily
daily_rf = math.pow(1 + risk_free_rate, 1 / 252) - 1

// 3. Volatility (standard deviation)
stddev_daily = ta.stdev(returns, stddev_length)
stddev_annual = stddev_daily * math.sqrt(252) * vol_scale

// 4. Sharpe Ratio
avg_return_daily = ta.sma(returns, sharpe_length)
avg_return_annual = avg_return_daily * 252
sharpe_ratio = (avg_return_annual - risk_free_rate) / (stddev_annual / vol_scale)
sharpe_ratio := na(stddev_annual / vol_scale) or (stddev_annual / vol_scale == 0) ? 0 : sharpe_ratio

// 5. ARCH Volatility
mean_return = ta.sma(returns, arch_lag)
squared_dev = math.pow(returns - mean_return, 2)
arch_vol_daily = math.sqrt(ta.sma(squared_dev, arch_lag))
arch_vol_annual = arch_vol_daily * math.sqrt(252) * vol_scale

// Plotting
plot(stddev_annual, color=color.yellow, title="Standard Deviation")
plot(sharpe_ratio, color=color.blue, title="Sharpe Ratio")
plot(arch_vol_annual, color=color.red, title="ARCH Volatility")
Sources: repo
License: CC BY-NC 4.0 (Educational use) Documentation: Indie Language Wiki Contributions: Open-source @ *Created for the TakeProfit.com Community by Pavel Medd